Calculation
In order to give an estimation of the potential quantity of \(CO_{2}\) emissions that an equivalent phase out among the fossil powered plants could have avoided, several assumptions are required.
Notations:
- \(M_{a}\): avoidable \(CO_{2}\) emissions.
- \(M_{rep}\): emissions generated from the production of the replacable energy \(E_{rep}\).
- \(M_{N}\): emissions generated from the production of same amount of energy \(E_{rep}\) but with nuclear power.
- \(E_{rep}\): quantity of energy considered as replacable.
- \(c_{rep}\): carbon intensity of the production of \(E_{rep}\).
- \(E_{N}\): quantity of energy that is assumed to be supplied by the nuclear capacity.
- \(c_{N}\): carbon intensity of the production of energy with nuclear power.
- \(E_{HC}\): quantity of energy that is elligible to be replaced with nuclear power is the energy produced from fossil fuels, which in Germany can be from lignite, coal or natural gas, referred as Highly Carbonated (HC).
- \(HCS\)= [\(lign\): lignite, \(coal\): hard coal, \(ngas\): natural gas].
- \(E_{lign}\): quantity of energy produced from lignite.
- \(E_{coal}\): quantity of energy produced from hard coal.
- \(E_{ngas}\): quantity of energy produced from natural gas.
0. Assumptions
- 1 - The nuclear energy porduction assumed available in the calculation is considered as a constant. The intermittent fuel replacement cycles and the maintenance cycles reponsible for planned power interuptions are flattened out over the operation timeline. Only a portion of the installed power is considered based on the actual energy production for a given installed power (data from the year 2010).
- 2 - The electricity exports and imports are not considered in this usecase, the focus is only on the German electricity production.
- 3 - Only the very high carbon rated sources of energy are being considered as potentially replacable. With the single goal of optimizing the carbon efficiency of the electricity production, it would be preferred to produce electricity using nuclear power upon any other source of energy with higher emissions intensity. However, the intention is not to question the deployment of renewables as source of electricity production. For instance, solar and Biomassa are sources of energy with higher carbon intensities than nuclear power but are not part of the sources targeted for being replaced by nuclear power.
1. Introduction
The form of energy production mentionned here is electricity, which is only a portion of the wider range of energy consumed in Germany.- Power - \(P\): Watts \([W]\) measure of power or \([We]\) for Watts electric to specify electric power.
- Energy - \(E\): Watt-hours \([Wh]\) - It is the energy consumed over a period of time. \(1kWh = 1000Wh\).
- Emissions - \(M\) - [\(gCO_{2}\)]: energy production produces gas emissions quantified in grams of \(CO_{2}\), especially during the combustion of fossil fuels.
- Carbon intensity - \(c\): [\(gCO_{2}\)/kWh] - defines how much emissions are generated per kilowatt hour.
2. Replacable energy \(E_{rep}\)
The replacable energy is the quantity of energy that is produced out of highly carbonated sources \(E_{HC}\), for which nuclear power could have been used for an assumed productive capacity of nuclear energy production \(E_{N}\). This quantity is defined by following expression: $$ E_{rep} = min(E_{N}, E_{HC}) $$Explanation
- In the case there is more energy produced out of the high carbonated sources (\(E_{HC}\)) than the assumed capacity of energy production from nuclear source (\(E_{N}\)), the actual replacable amount of energy is limited by the assumed nuclear capacity. Therefore: \(E_{HC}\ge E_{N} \Rightarrow E_{rep} = E_{N}\).
- In the case there is less energy produced out of the high carbonated sources (\(E_{HC}\)) than the assumed capacity of energy production from nuclear source (\(E_{N}\)), the actual replacable amount of energy is limited by the actual energy produced out of the high carbonated sources of energy. Therefore: \(E_{HC}\le E_{N} \Rightarrow E_{rep} = E_{HC}\).
3. Decomposition of the high carbonated energy \(E_{HC}\)
Among the high carbonated energy, there is energy produced out of lignite, hard coal and natural gas identified as the highly carbonated sources \(HCS\), which all have different carbon intensities. The emitted \(CO_{2}\) per unit of energy produced depends on the source and it is necessary to distinguish the amount of energy produced for each of them. A kWh of electricity produced out of natural gas produces almost twice as much \(CO_{2}\) emissions compared to a kWh produces out of lignites (see table below). There are also other sources of energy production with higher carbon intensities than nuclear power, but these are considered as part of the renewable sources of energy and it's not intended to replace that part, even though there is still a benefit in terms of lowering \(CO_{2}\) emissions.\(E_{HC}\) Related emissions
The total emissions generated for the production of electricity from high carbonated sources can be calculated from the energy produced from each source and the corresponding carbon intensity of that source: $$ M_{HC} = c_{HC} \cdot E_{HC} $$ $$ M_{HC} = \sum_{i \in HCS} M_{i} = \sum_{i \in HCS} c_{i} \cdot E_{i} = c_{lign} \cdot E_{lign}+c_{coal} \cdot E_{coal}+c_{ngas} \cdot E_{ngas} $$ The carbon intensity of the high carbonated energy \(c_{HC}\) is defined by: $$ c_{HC} = \frac{M_{HC}}{E_{HC}} $$4. Substitution rate
As defined earlier, the replacable quantity of energy is given by \(E_{rep} = min(E_{N}, E_{HC})\), for which there are 2 possibilities to calculate \(E_{rep}\):- First case: \(E_{HC}\le E_{N} \Rightarrow E_{rep} = E_{HC}\). The replacable quantity of energy is the total energy composing \(E_{HC}\).
- Second case: \(E_{HC}\ge E_{N} \Rightarrow E_{rep} = E_{N}\). Only a part of \(E_{HC}\) is then physically replacable and requires a selection of the part of that energy could be replaced.
The replacable quantity of energy can then be written as a sum where each summand has a substitution rate defined as \(a \in [0,1]\): $$ E_{rep} = \sum_{i \in HCS} a_{i} \cdot E_{i} = a_{lign} \cdot E_{lign}+a_{coal} \cdot E_{coal}+a_{ngas} \cdot E_{ngas} $$ Note: When \(E_{rep} \le E_{N}\), the whole quantity of energy is replaceable and all the substitution rates are equal to 1, \(a_{i}=1\) for \(i \in HCS\).
Examples:
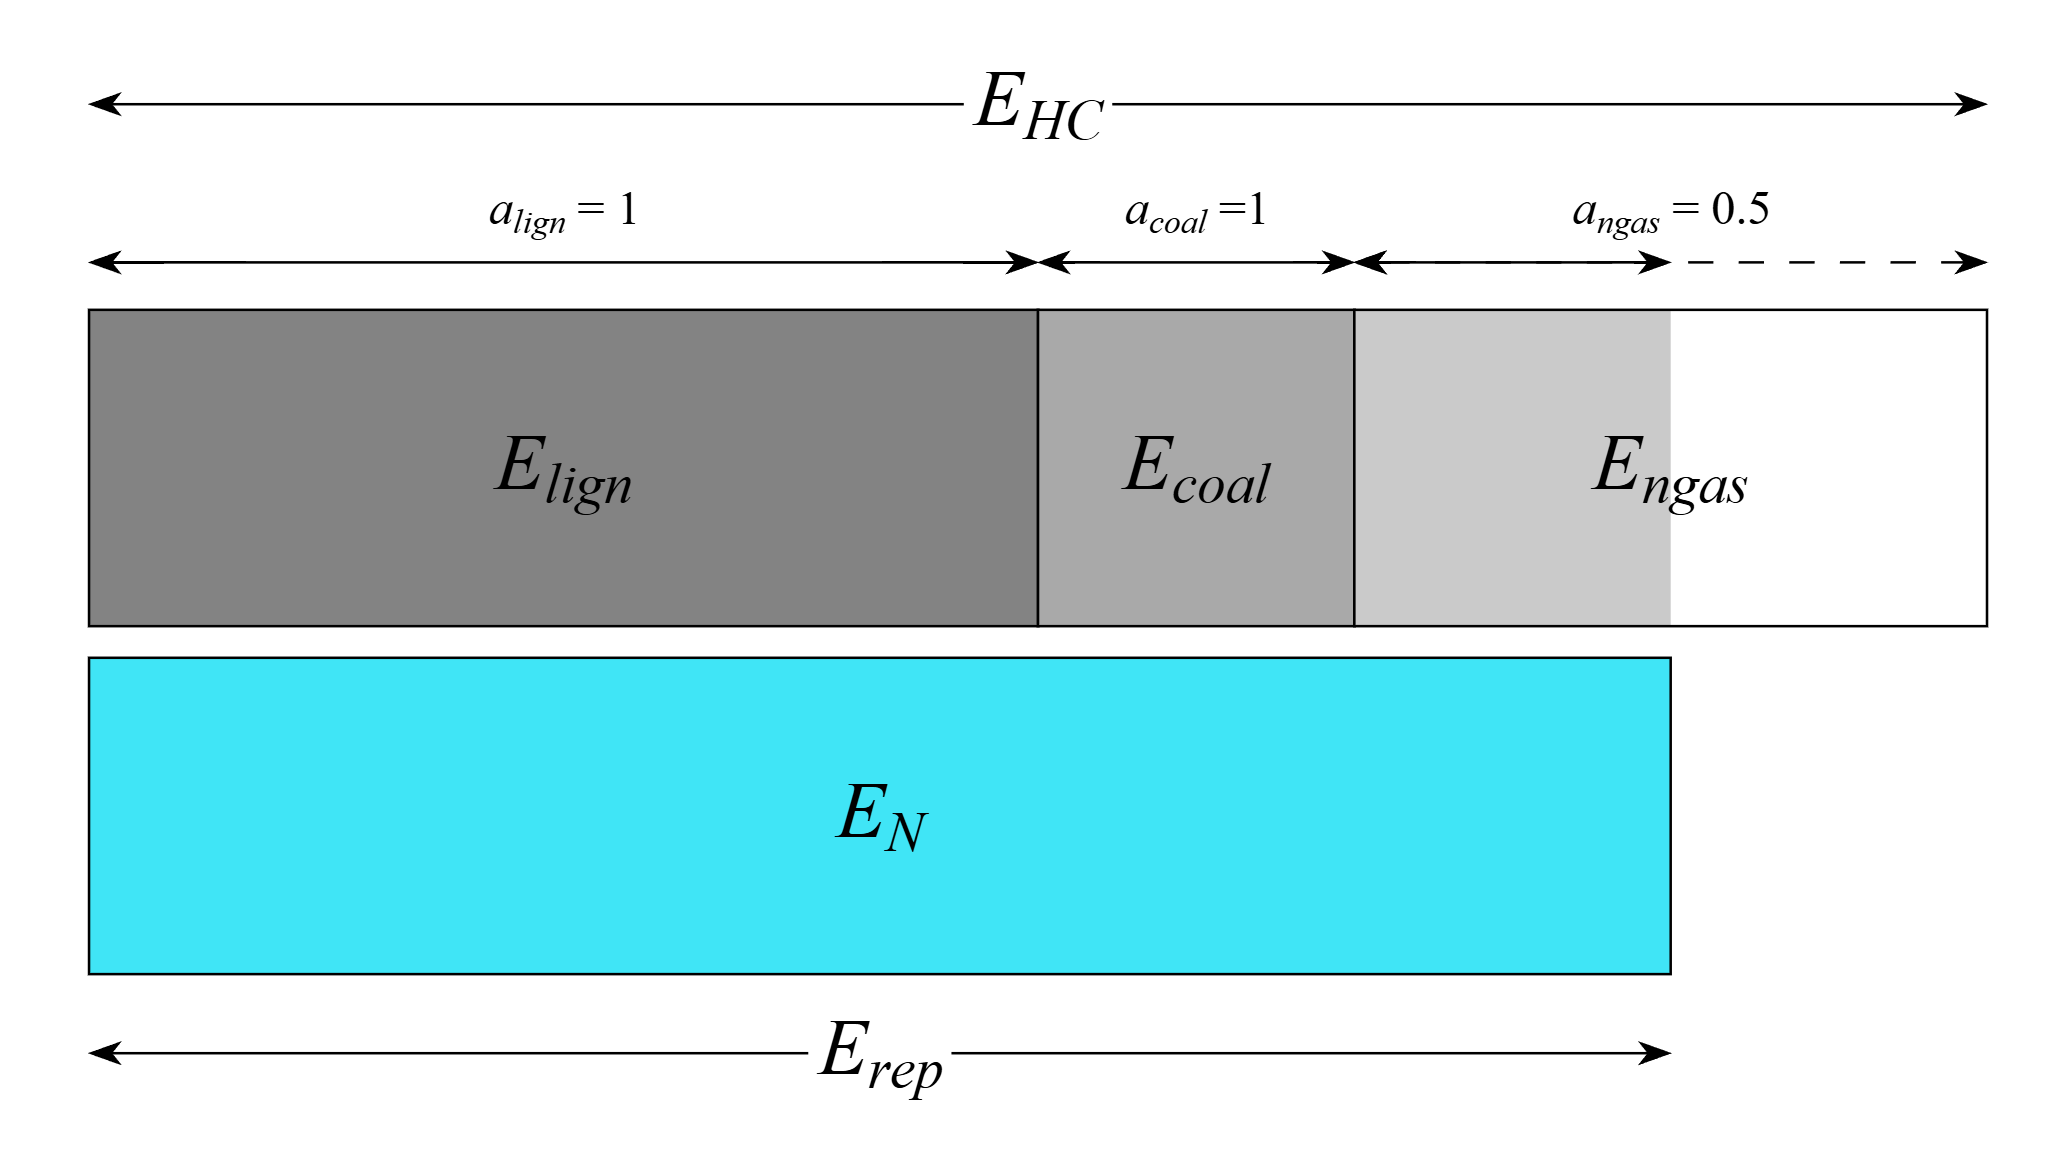
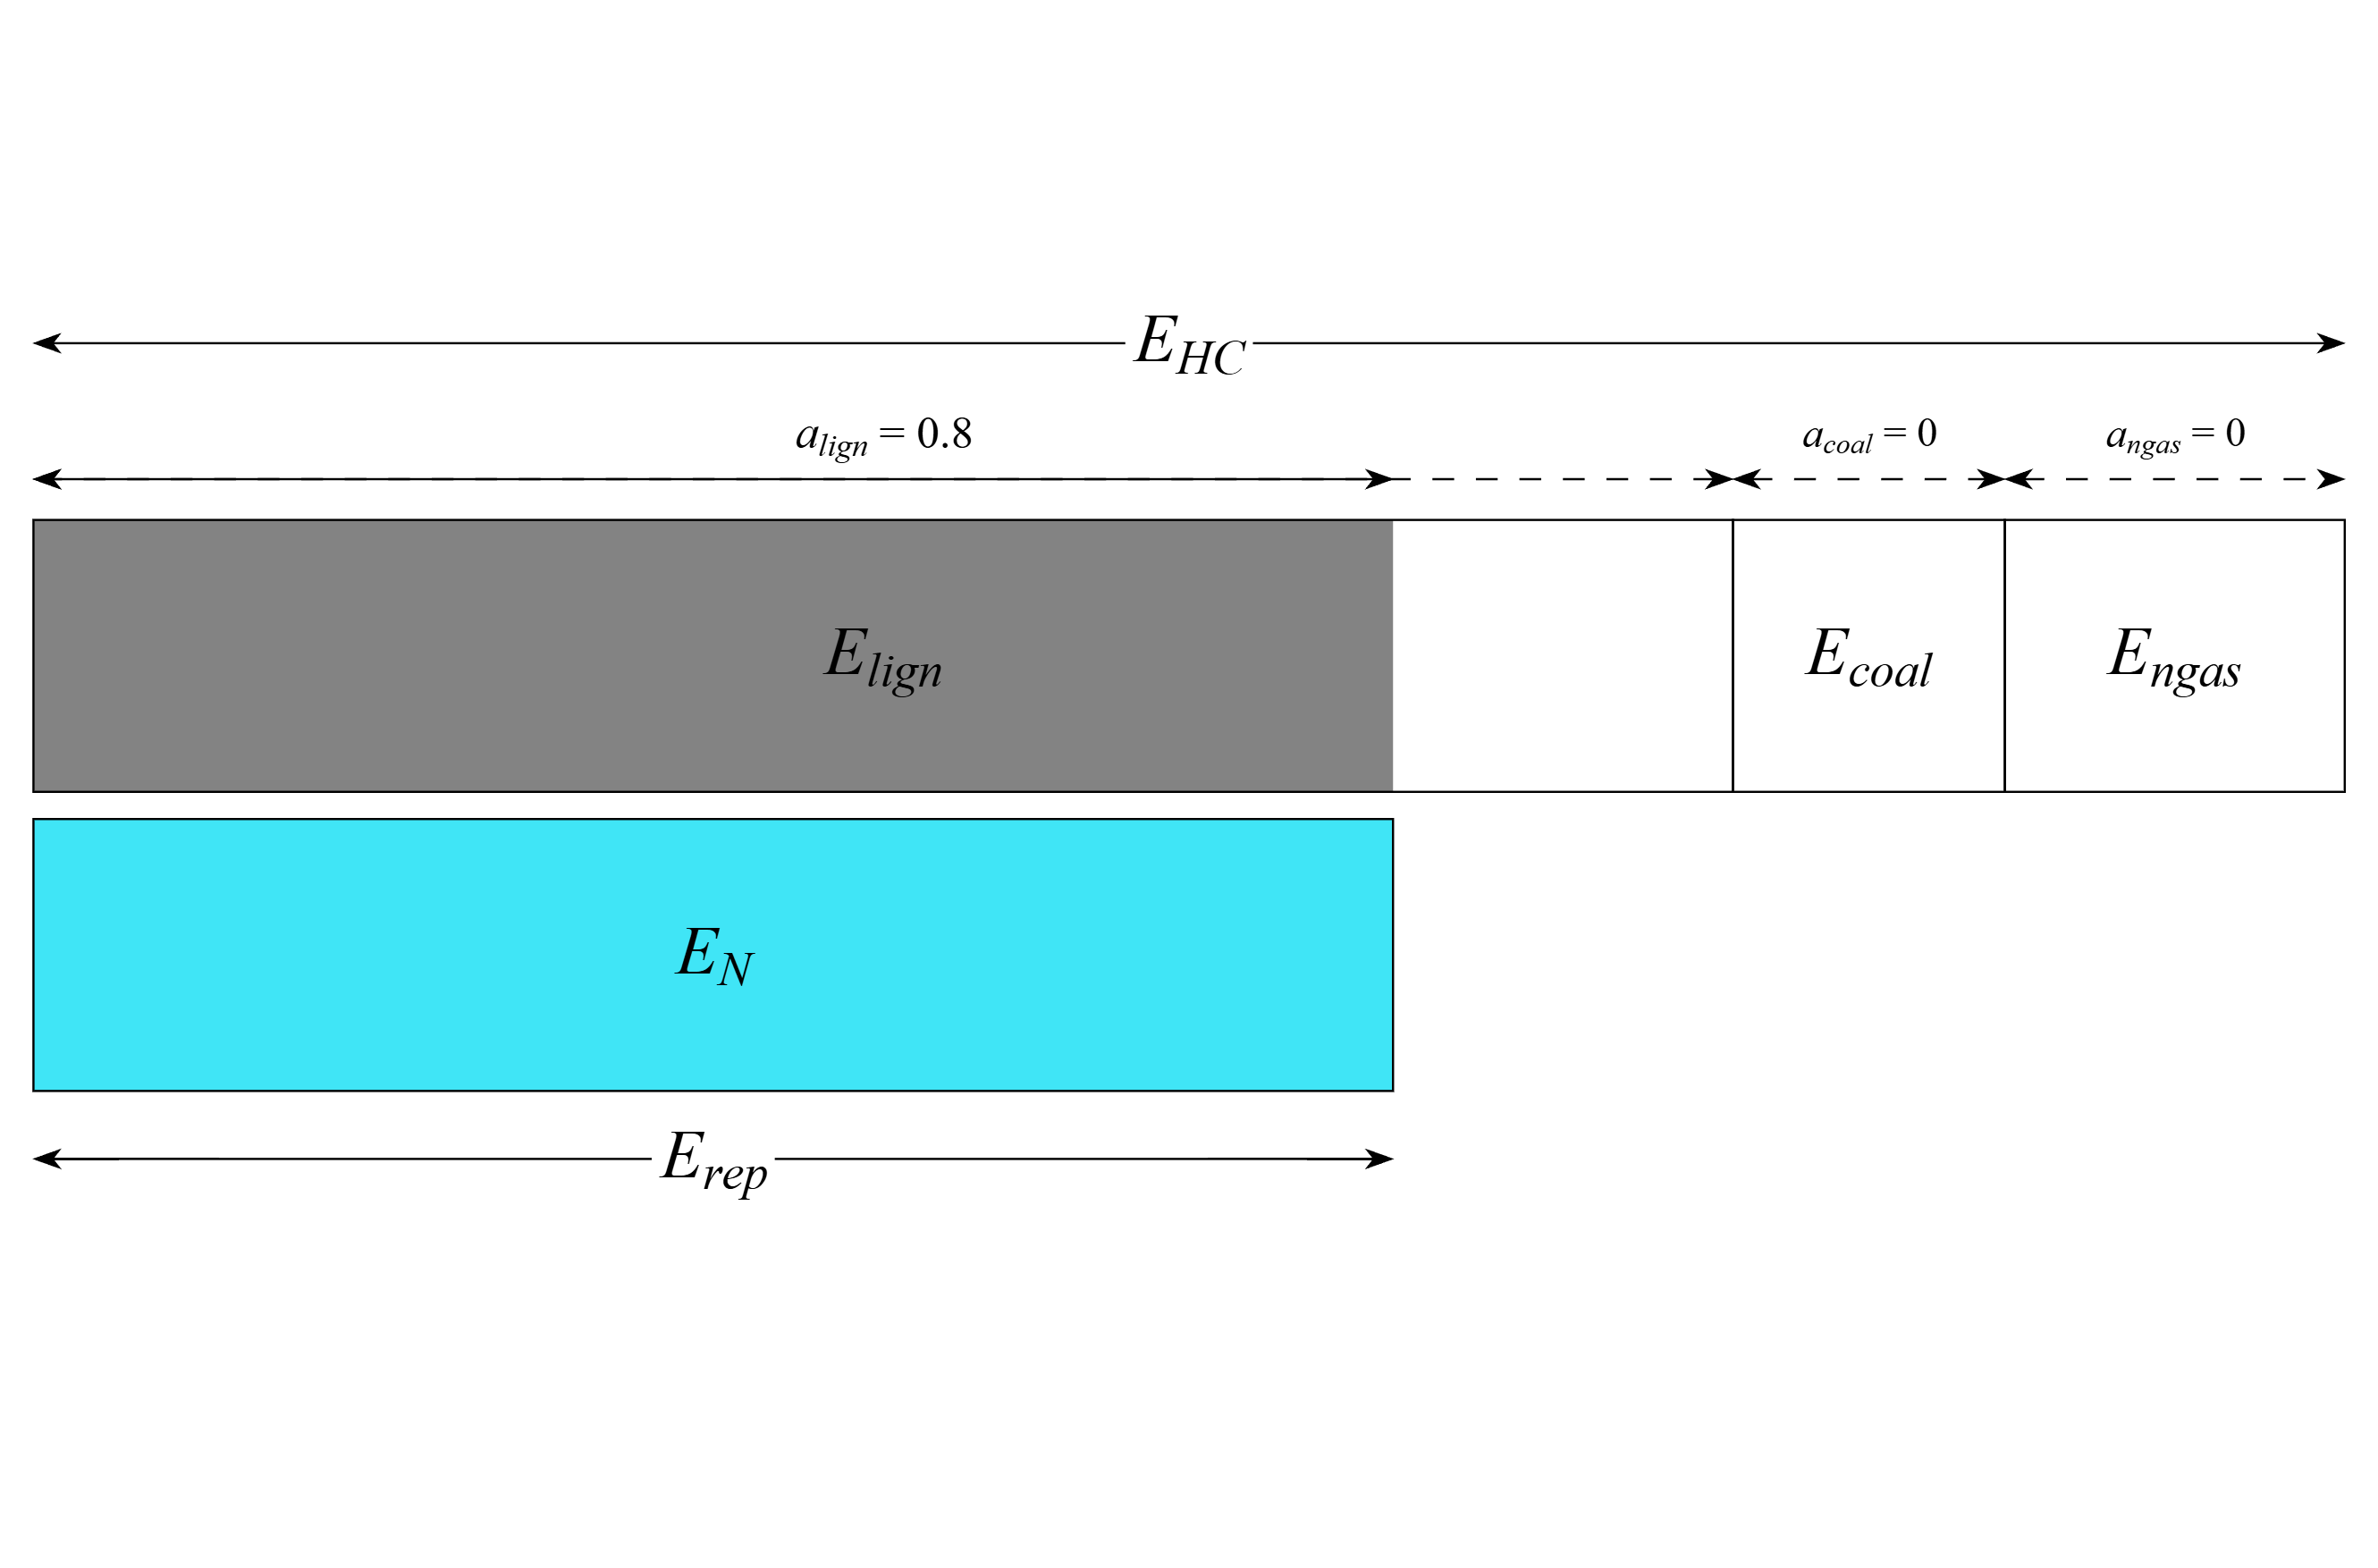
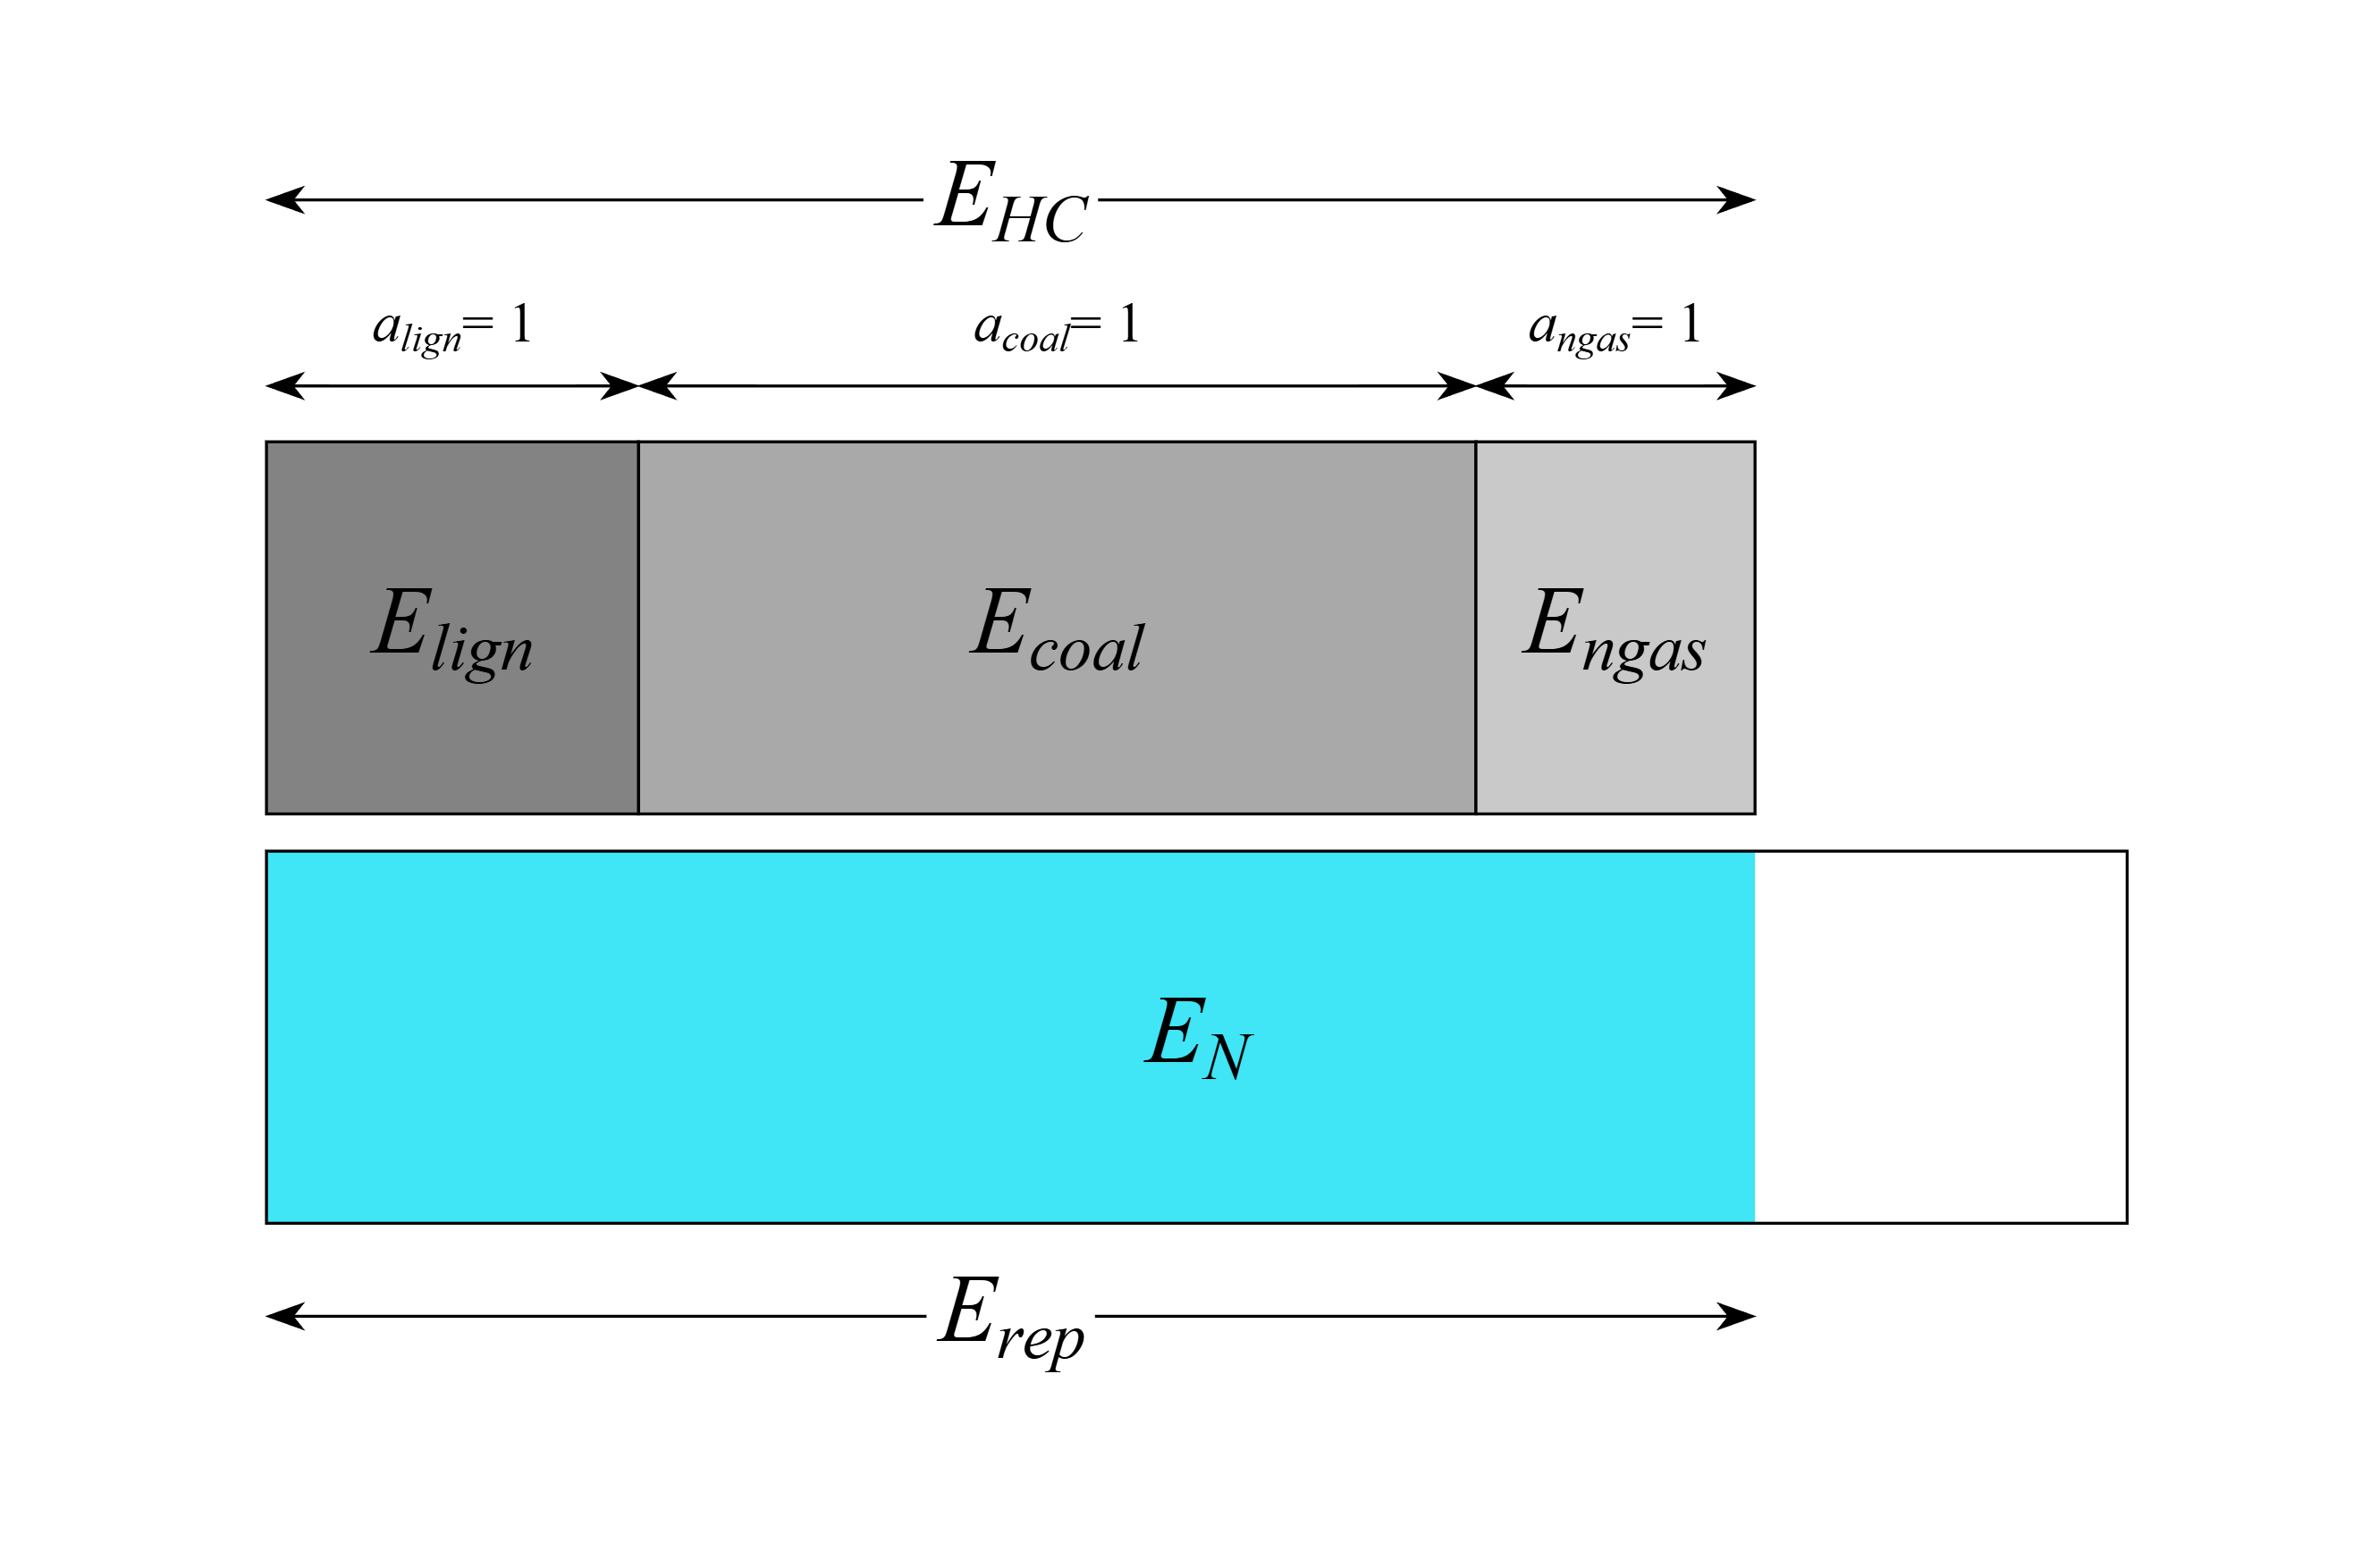
In the following examples, different situations are presented where \(E_{N} = 100 Wh\) to illustrate how the substitution rates are affected:
Example 1:
$$ \begin{align}
&E_{lign}=60Wh, E_{coal}=20Wh, E_{ngas}=40Wh \\
&E_{HC} = E_{lign}+E_{coal}+E_{ngas} = 60 + 20 + 40 = 120 Wh\\ \\
&E_{HC} \ge E_{N}:\\
&E_{rep} = E_{N} = 1\times60+1\times30+0.5\times40 = 100Wh \\ \\
&\mathbf{a_{lign} = 1, a_{coal} = 1, a_{ngas} = 0.5}
\end{align}$$
Example 2:
$$ \begin{align}
&E_{lign}=125Wh, E_{coal}=20Wh, E_{ngas}=25Wh \\
&E_{HC} = E_{lign}+E_{coal}+E_{ngas} = 125 + 20 + 25 = 180 Wh\\ \\
&E_{HC} \ge E_{N} \\
&E_{rep} = E_{N} = 0.8\times125+0\times20+0\times25 = 100Wh \\ \\
&\mathbf{a_{lign} = 0.8, a_{coal} = 0, a_{ngas} = 0}
\end{align}$$
Example 3:
$$ \begin{align}
&E_{lign}=20Wh, E_{coal}=45Wh, E_{ngas}=15Wh \\
&E_{HC} = E_{lign}+E_{coal}+E_{ngas} = 20 + 45 + 15 = 80 Wh\\ \\
&E_{HC} \le E_{N} \\
&E_{rep} = E_{HC} = 1\times20+1\times45+1\times15 = 80Wh \\ \\
&\mathbf{a_{lign} = 1, a_{coal} = 1, a_{ngas} = 1}
\end{align}$$
5. Expression for the potential avoided emissions
All the required terms to determine the avoidable amount of emissions are defined, $$ \begin{align} &M_{a} = c_{rep} \cdot E_{rep} - c_{N} \cdot E_{rep} \\ &M_{a} = (\frac{1}{E_{rep}} \cdot \sum_{i \in HCS}c_{i} \cdot a_{i} \cdot E_{i}) \cdot E_{rep} - c_{N} \cdot E_{rep}\\ &M_{a} = \sum_{i \in HCS}c_{i} \cdot a_{i} \cdot E_{i} - c_{N} \cdot \sum_{i \in HCS}a_{i} \cdot E_{i}\\ &M_{a} = \sum_{i \in HCS}(c_{i}-c_{N}) \cdot a_{i} \cdot E_{i} \end{align}$$
$$ \boxed{\mathbf{M_{a} = (c_{lign}-c_{N}) \cdot a_{lign} \cdot E_{lign} + (c_{coal}-c_{N}) \cdot a_{coal} \cdot E_{coal} +(c_{ngas}-c_{N}) \cdot a_{ngas} \cdot E_{ngas}}}$$
Supposed nuclear installation
The result of the proposed calculation is highly dependant on the supposed installed nuclear power and more specifically on the assumed suppliable nuclear power which determines the value for \(E_{N}\). The higher the value of \(E_{N}\), the higher the replacable amount of energy \(E_{rep}\) and therefore, the higher the avoidable amount of emissions gets. A nuclear installation is not different than any other and requires planned production stops for refueling or for maintenance purposes in order to assure a good operation state of the installation. Therefore, there is a difference between the installed power and the actual production. The planned interuptions of the production impacts the actual production of electricity which, flattened out over time represents a fraction of the installed power.In the year 2010, the installed power for electricity production from nuclear installation in Germany was about \(P_{N_{max}} = 20490MWe\). Because of the normal production schedule of nuclear facilities, the average power for the year 2010 was \(P_{N} = 15183MWe\).
Explanation:
The amount of energy producable from the existing nuclear facility in 2010 is defined by: $$ \begin{align} &E_{N_{max}} = P_{N_{max}} \cdot Hours \\ &E_{N_{max}} = 20490 \cdot (365 \cdot 24) \\ &E_{N_{max}} = 179492400 MWh \\ &E_{N_{max}} = 179.49 TWh \end{align}$$ The actual net production in 2010 is reported to be about \(E_{Na} = 133TWh\) according to https://world-nuclear.org/information-library/country-profiles/countries-g-n/germany. From the actual produced amount of energy, the portion of the installed capacity actually being produced is defined by \(r = \frac{E_{Na}}{E_{N_{max}}} \approx 74.1\% \).
Therefore, the average power for net production durung the year 2010 is given by: $$P_{N} = r \cdot P_{N_{max}} = 0.741 \times20490 \approx 15183MWe$$ In the calculation detailed previously, the energy considered suppliable from nuclear source during a period \(T\) is defined by: $$E_{N}(T)=P_{N}\cdot T$$. As the period of time used is \(15min\) or \(0.25hours\), the amount of energy considered is: $$E_{N} = 15183 \times 0.25 \approx 3796MWh = 3.796\times10^{6}kWh$$.
Results
The results given by the calculation remains an approximation of the amount of emissions that could have been avoided with the continuity of the production of electricity using nuclear power.The result gives an order of magnitude of the direct consequence on Germany's emissions for its electricity production after the decision of quitting nuclear power. Altough the calculation is based on a 15min update interval, it has been chosen to display the result in a higher refreshing frequency to emphasize the continuously increasing
Source
The idea of this website was inspired by the work of Jean-Marc Jancovici, please visit: jancovici.comReferences


F.A.Q
Is the estimation also considering the maintenance and refuelling interuptions of a nuclear power plant?
Yes, in the parameters of the calculation, the installed nuclear power is adjusted with the actual electricity production which includes the planned interuptions for maintenance and fuel replacement.
Are the electricity imports included?
No, only the national electricity production is considered. The import of low carbon rated electricity as well as the electricity exports are ignored in this project.
Is fission nuclear energy the solution for long term electricity supply?
Electricity produced out of nuclear fission requires mining of uranium ore, a limited resource on earth.
Why starting the counter from August 6th 2011?
The phase out project was mostly an idea and consequence of the Chernobyl accident from 1986. However the actual phase out took place after the Fukushima Daiichi incident from March 11th 2011 when eight nuclear facilities closed on August 6th 2011. The first wave of closure marks the start of the counter assuming the closure had affected the equivalent in installed power among the fossil fuel power plants.
Is the progressive phase out included in the calculation?
The phase out has not been a sudden shutdown of the nuclear capacity. This progressive phase is also considered in the calculation and is to be observed in the velocity at which the counter is going up.
Why is the counter's value possibly higher than other existing estimations?
The reason why the value is being high leans on the hypothesis that the effort made to phase out of nuclear power was transferred on the fossil power plants. This goes further than only continuing operating the nuclear and fossil power plants, as it is assumed that the same level of investments in the development of renewables would have been organized to replace the missing power generated out of fossils.